This post is the first in a series about the state legislative races going on in 2024. I’ve put together a dataset on the roughly 7,400 state legislative incumbents in the country right now, 5,800 of whom will be on the November 5, 2024 general election ballot. Using a combination of state secretary of state websites, Wikipedia, and Ballotpedia, I’ve assembled data on the most recent elections every current state legislative incumbent has most recently faced and will be writing about that data (and other matters of state legislature politics) through 2024.
The majority of these most recent elections occurred in 2022 (most state legislative lower chambers) or 2020 (mostly the various upper chambers that stagger their terms), but range from the 2018-2023 period. This data includes each incumbent’s geography, party, most recent vote, most recent vote share, similar data for their most recent challenger (if any), and a raft of district demographic data I’ll explore in future posts, which I assembled from a variety of sources chief among them NHGIS.
At the beginning of 2024, somewhere in the neighborhood of 13.2 percent of state legislative races can be considered “competitive” using a simple rule of thumb such as that seat most recently being won by a two-party vote margin of less than 10 percentage points, or a spread of 5 percent between the first-place finisher and the second-place finisher. Of the 5,776 state legislative seats that will be on the November 4, 2024 general election ballot, 827 were most recently won by a margin of less than 10 percentage points (or a spread of less than 5 percent). Subtracting races where the final race wasn’t between a Democrat and a Republican (say, a Democrat against a Democrat as is common in California or Republican against a Republican as is common in a handful of southern states), 746 races were competitive two-party races in this period. Fully 621 of those happened outside of New Hampshire, whose lower legislature districts are very small and unevenly-populated.
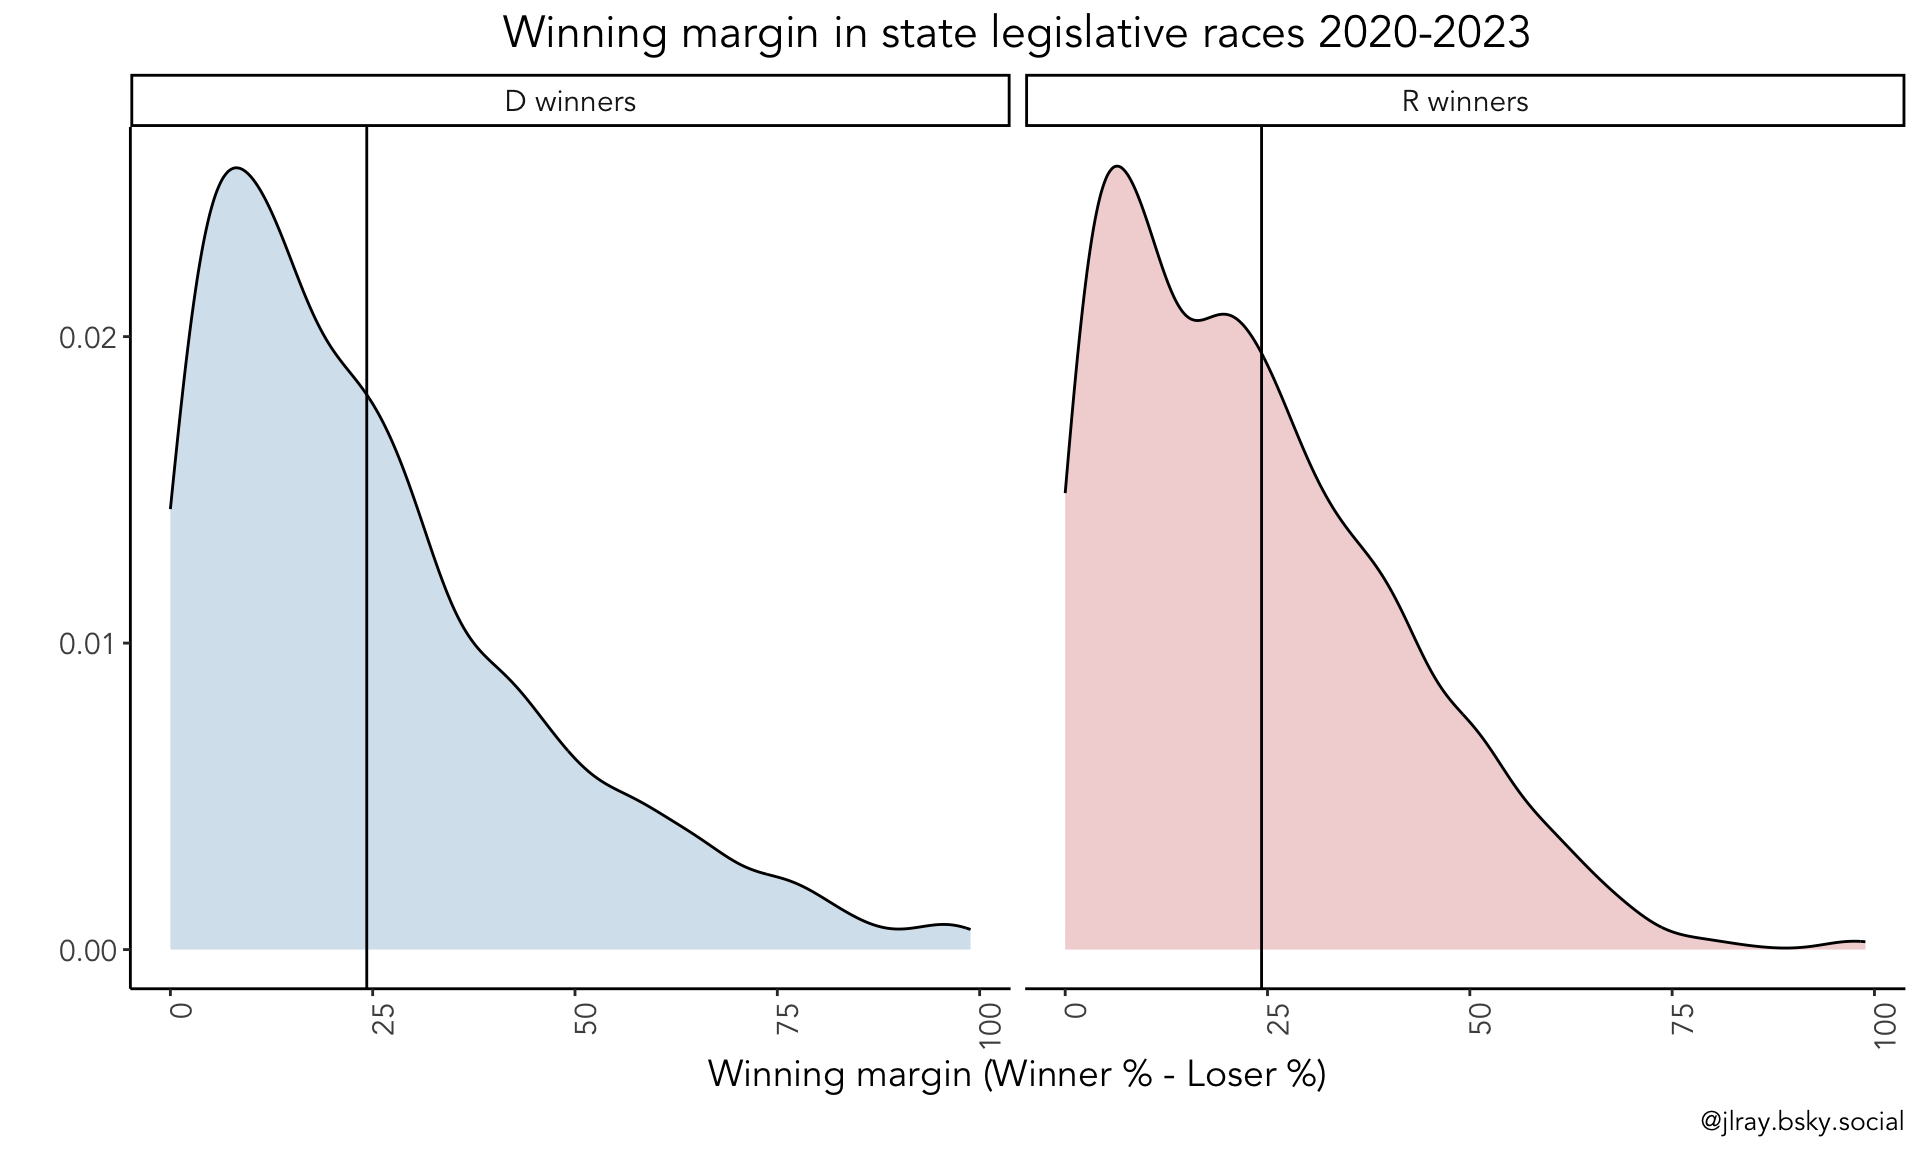
Most state legislators are electorally safe. The average margin of victory in a state legislative race between two major-party candidates (i.e., a Dem vs. a Rep) in the 2020-2023 period was about 25.5 percentage points, with a median margin of victory of 21.7 percentage points. About 36.6 percent of state legislative races went uncontested in this period, and a further 1.4 percent featured a major-party candidate with only a minor/third-party opponent. In other words, just over half of state legislative races were “seriously” contested. These stats, overall, aren’t too different by party. The average Democratic state legislative candidate who faced a major-party challenger in this time period won their race by a 26.1 percentage point margin (or a 13-percent spread), and the average Republican won their race by a 24.9 percentage point margin.
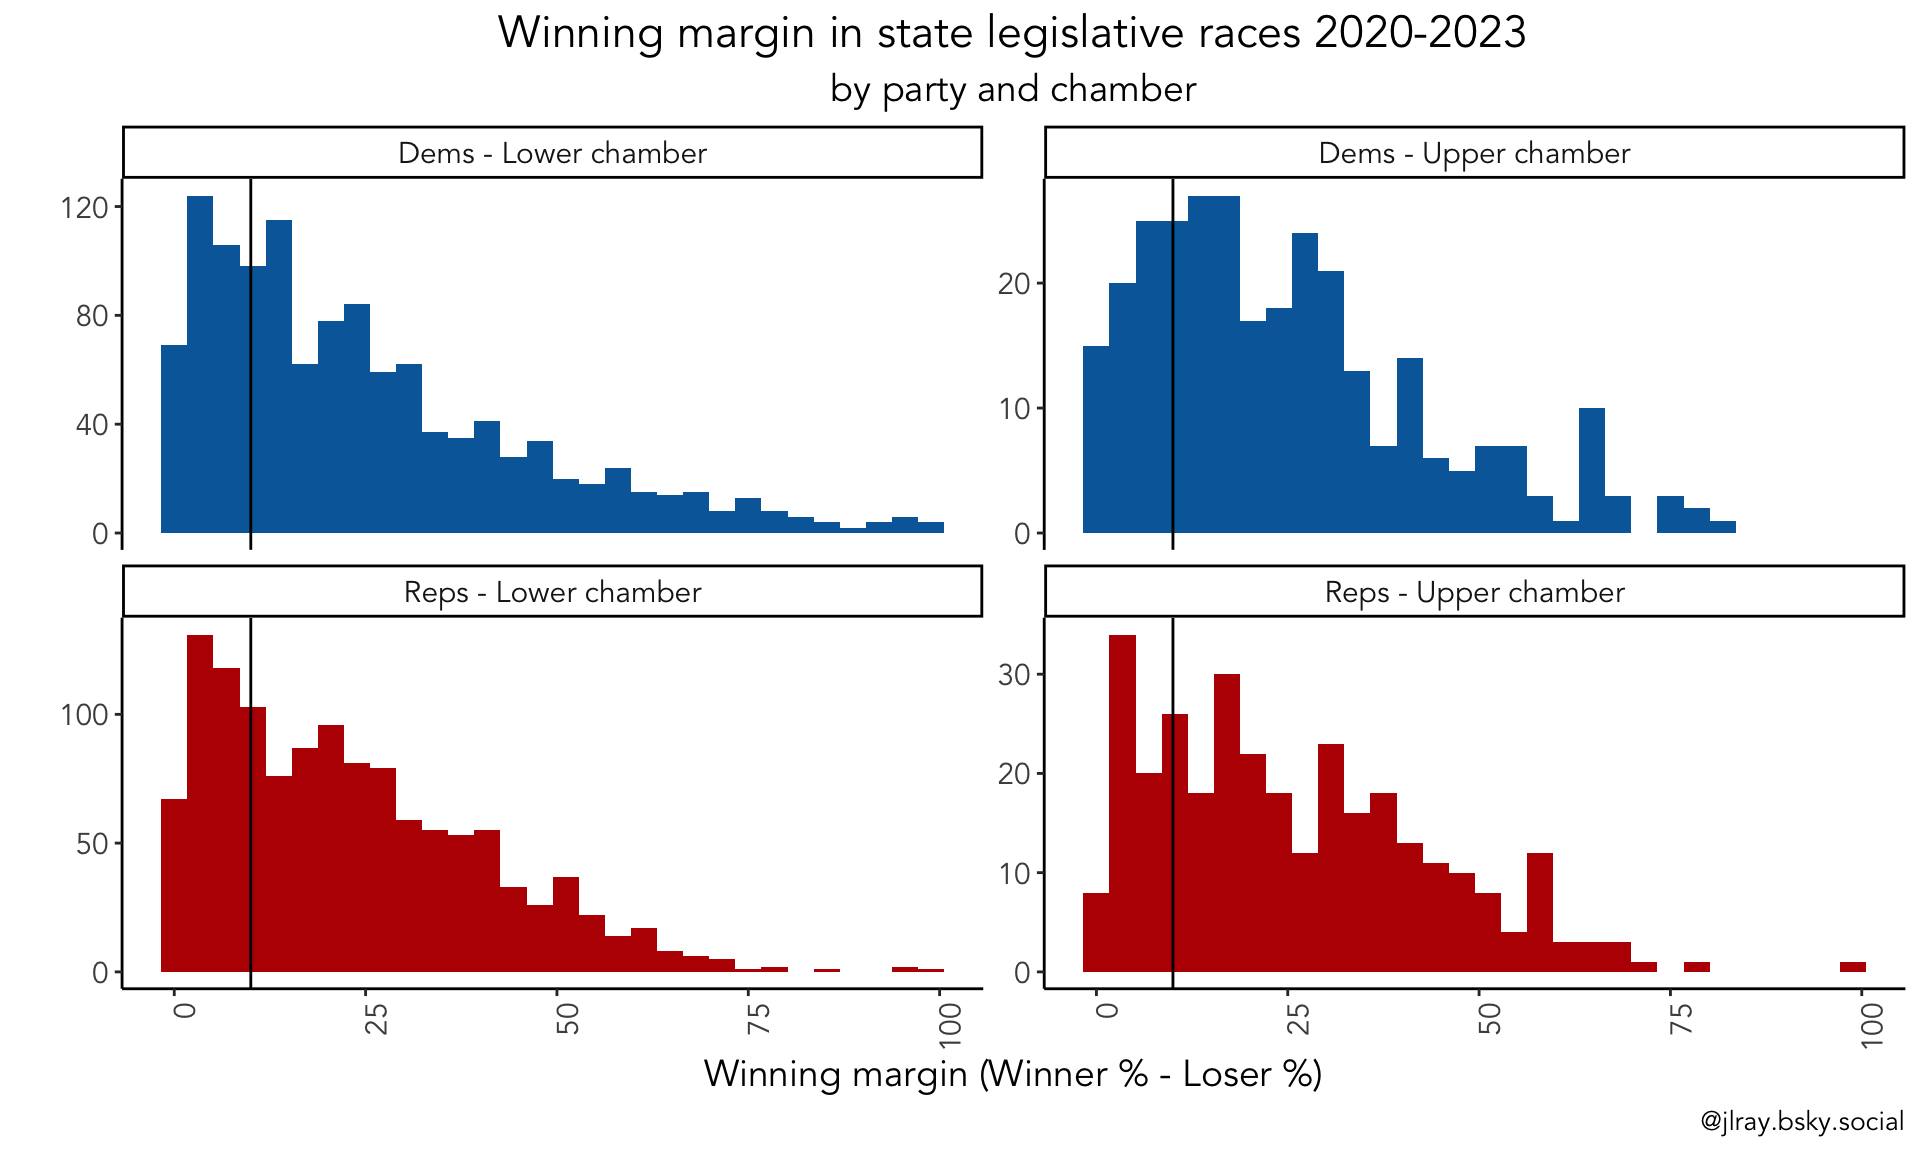
This doesn’t vary much by chamber. Democratic lower chamber candidates facing major-party challengers won by an average of 26 percentage points, and by 24 for Democratic upper chamber candidates. The average Republican lower house seat winner who faced a Democrat won by about 25 percentage points, and by about 25 percentage points in upper chambers.
In total, among the 746 “swing” state legislative races (those won by a margin of less than 10 percentage points, or a 5-point spread, by a Democrat facing a Republican or vice versa), there is near-exact parity between the parties. Of the 746 state legislative races coming up in 2024 where the most recent general election contest was won by a 5-point spread or less, 353 were Republican lower chamber candidates and 393 were Democratic (including 378 “Democrats”, 13 “Democrat-Farm-Labor” candidates in MN, and 2 “Democratic-Nonpartisan League” candidate in ND) lower chamber candidates. There are also 3 Independent candidates holding swing lower chamber seats up in 2024 (Dan Ortiz in Alaska, who caucuses with the Democrats, Jon Brien, who has previously run as a Democrat in other races, in Rhode Island, and Walter Risema in Maine). So if we count the two DIABNOs (Democrats In All But Name Only), 2024 will include 273 swing R seats and 318 swing D seats in lower chambers, plus 77 swing D seats in upper chambers and 80 swing R seats in upper chambers.
New Hampshire, as always, complicates things. Of the 746 competitive races in the county using the “10 percentage point margin/5 percent spread among major party competitors” metric, fully 125 are in New Hampshire – 52 Democrats in the lower chamber, 66 Republicans in the lower chamber, 2 Democrats in the upper chamber, and 5 Republicans in the upper chamber. This is because the uneven and often extremely small electorates in New Hampshire districts greatly overstates the competitiveness of some races. This means the typical metric used to determine whether a district is a “swing” district is a poor fit for places like New Hampshire, where seats that permit upwards of four winners inevitably means winning margins for individual candidates will be small even though overall partisan advantages are lopsided. I’ll cover New Hampshire in more detail in a future post. So in the meantime, even though there absolutely are competitive races in New Hampshire, I’ll proceed with the 621 non-New Hampshire swing races we’ve got for the visualizations to follow.
Note that in 2024 many state legislatures are not on the table at all. There are no general elections for the state legislatures at any level in Alabama, Louisiana, Maryland, Mississippi, New Jersey, or Virginia in 2024. Additionally, Michigan’s narrowly contested upper chamber is not on the ballot in 2024. And in most states, not all of the upper chamber is contested every cycle. Only a dozen states (AZ, CT, GA, ID, MA, ME, NC, NH, NY, RI, SD, VT) elect their full chambers to two-year terms, with most electing their upper chambers to four-year terms or a “2-4-4” staggered system. In addition to the, er, electoral limitations, there are structural constraints on how many state legislative seats could flip in any given cycle.
The following chart lays out the state legislative seats that will be on the ballot in November 2024. On the far right and left of each pane I’ve included each legislative chamber’s seats that aren’t on the ballot at all in 2024, with the safe Dem and Rep seats next inward, followed by the swing seats and third party seats in the middle. I’ve also added dotted lines at 33 percent, 50 percent, and 66 percent of each chamber to give a rough idea of where each party controls majorities and veto-proof majorities.
In some cases, there is little apparent chance for a major sea change in most states’ legislatures in 2024. At the bottom of the chart, for example, we can see the tiny Democratic presence in states like Wyoming and West Virginia have little chance of moving. Not only is virtually every Wyoming state legislator a safe Republican, no swing seats are actually on offer in Wyoming in 2024. Right above it, even if Democrats swept the handful of swing seats in West Virginia’s lower chamber, it would barely put a dent in Republicans’ current 89-11 control of the State House and 31-3 control of the State Senate.
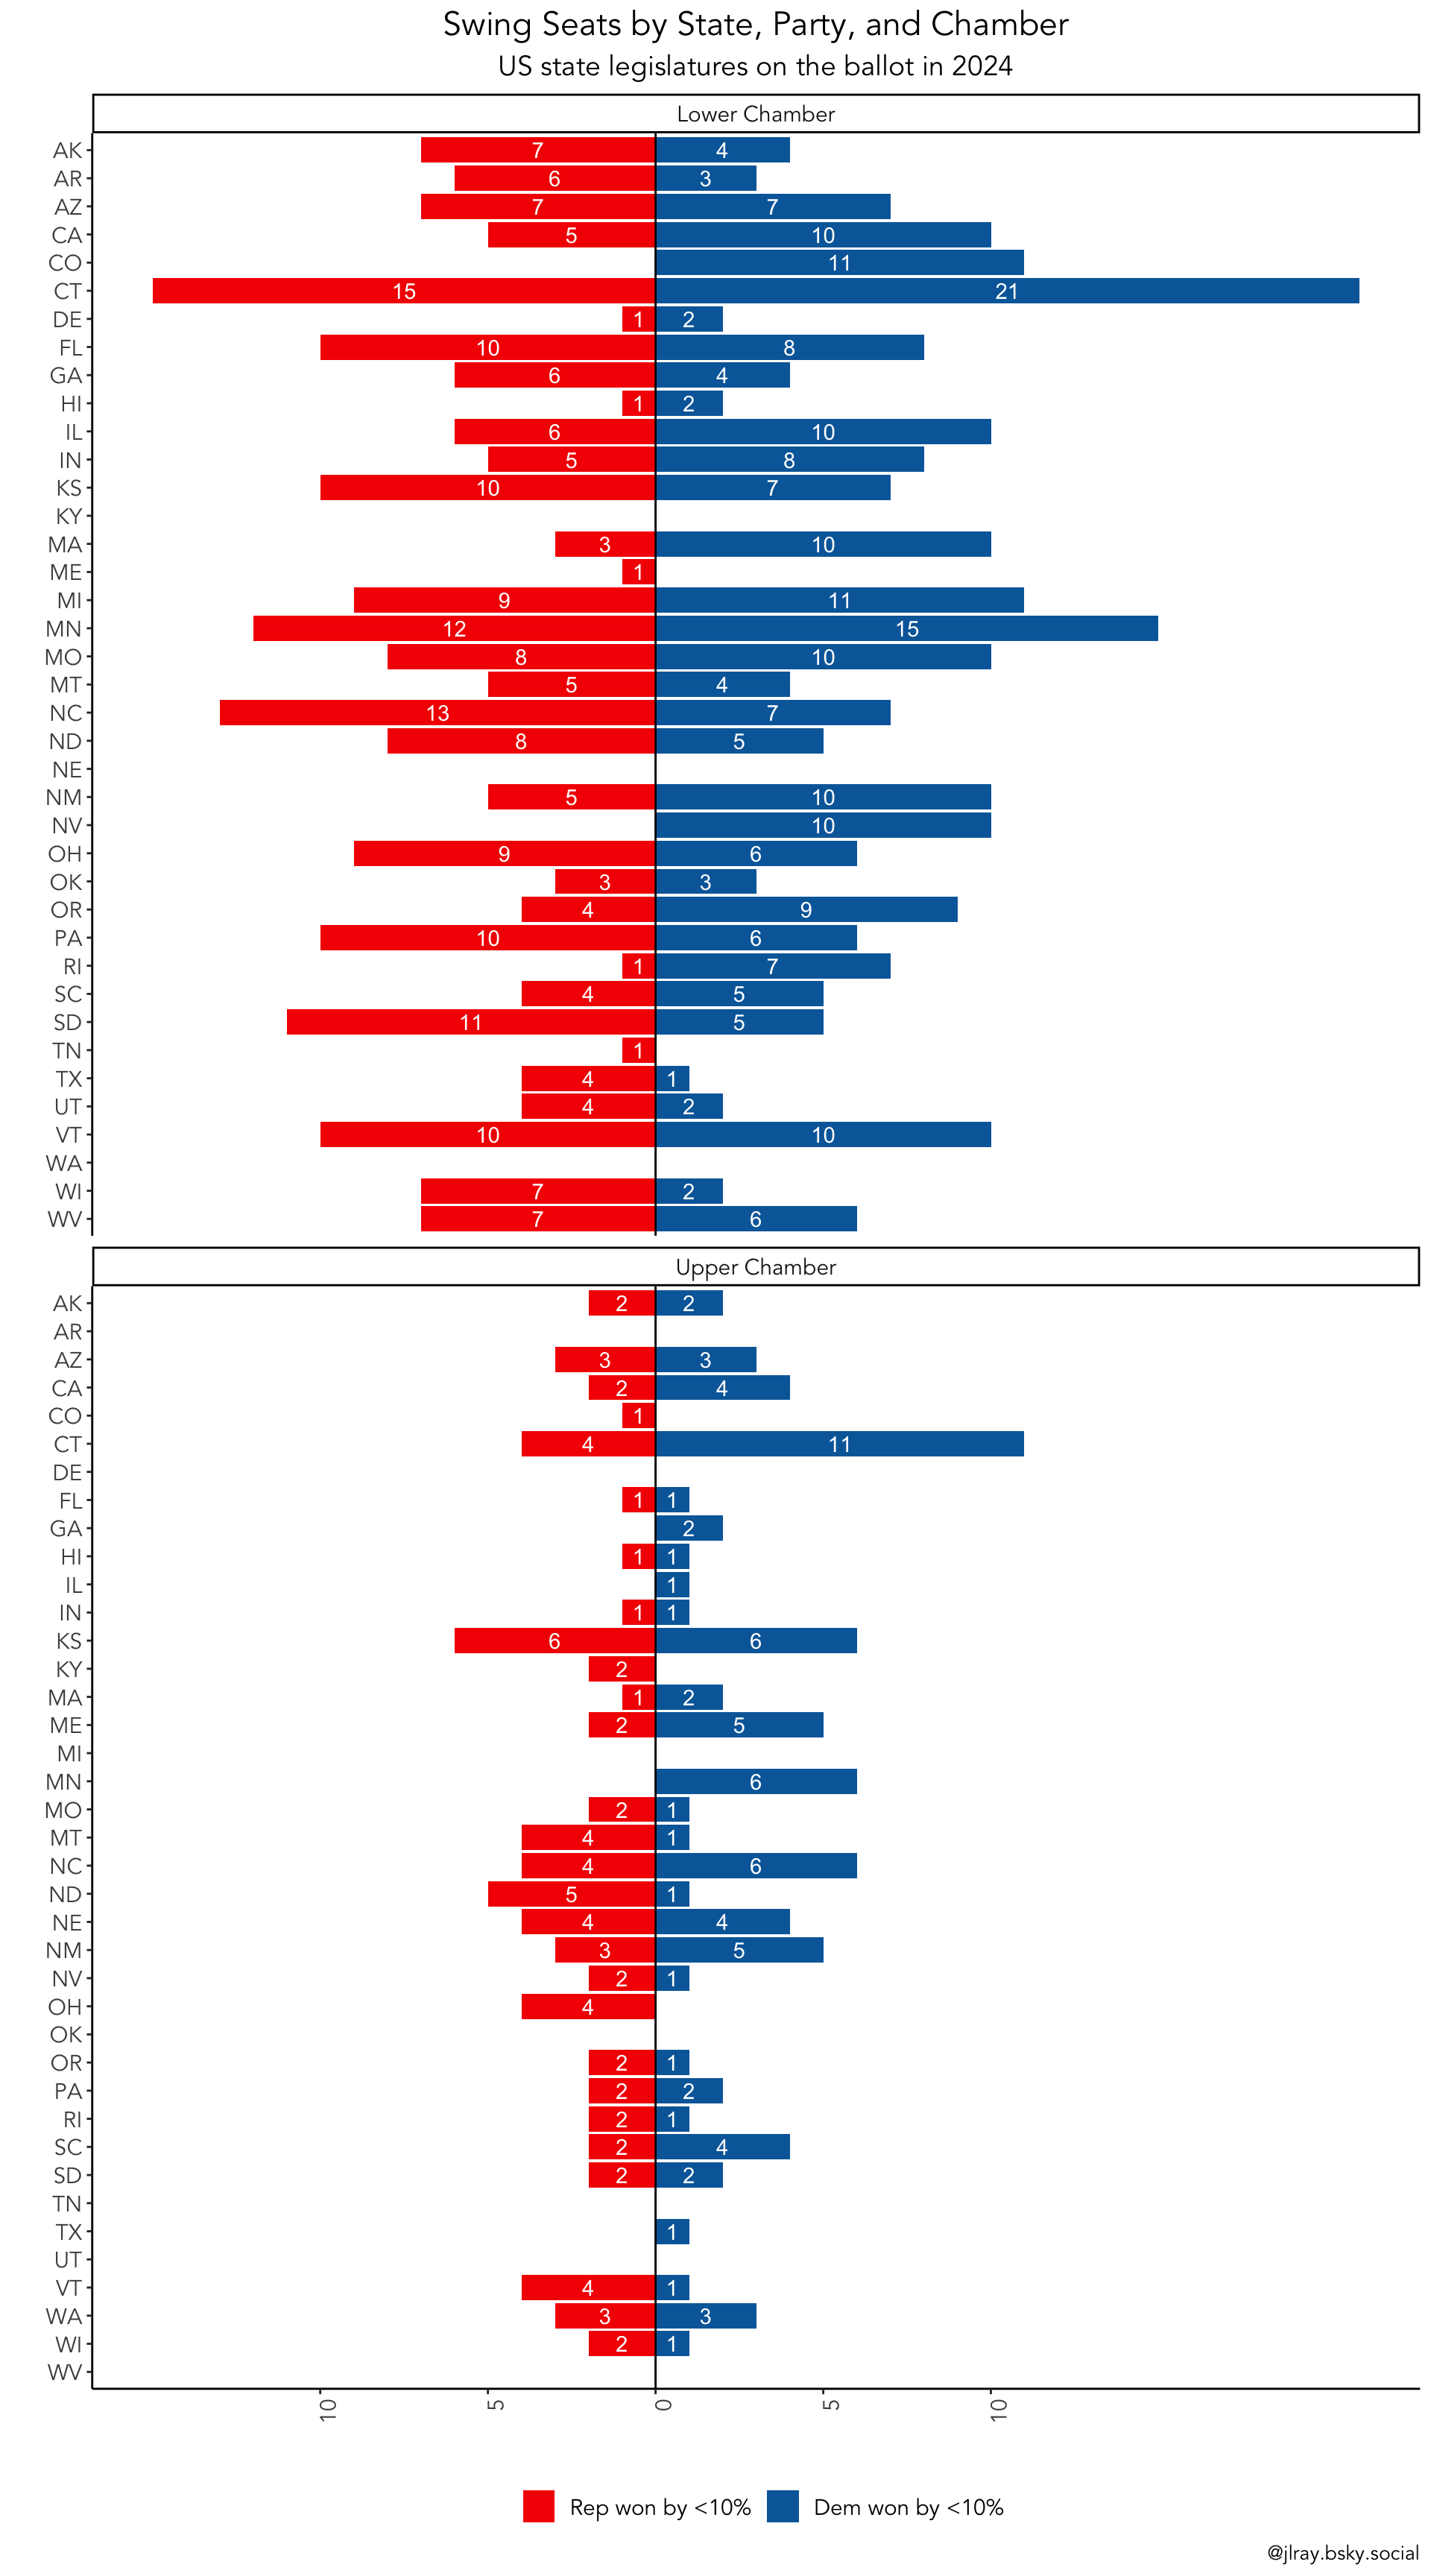
Even in the most intriguing cases such as North Carolina, where there are theoretically enough swing seats to flip the lower chamber in 2024, Democrats would have to flawlessly knock down twelve incumbents while losing none of their own. Michigan and Minnesota both look pretty competitive on paper but both states’ GOPs are known to be having candidate recruitment struggles – a topic which requires its own, separate analysis. Alaska’s intra-party and third-party politics are so all over the place its hard to know immediately what to make of the relatively high number of supposed “opportunities” there. It looks like Democrats may have a chance to break Republican supermajorities in some states such as Ohio, but any such chance requires winning a fairly long string of races. Though it appears there is a big chunk of vulnerable R seats in the New Hampshire lower chamber, New Hampshire has 400 state legislators in its lower chamber and uneven multi-member districts, which can produce the appearance of more swing districts when in reality there are so many seats available in each district (two of NH’s districts had nine positions to fill in 2022!) that winning margins are clearly understated by the sheer number of candidates each voter may select.

Of the state legislature seats that will be on the ballot in November 2024, here are the seats where, in the most recent general election for that seat, the incumbent won by less than 10 percentage points (or a 5-percent spread) in a two-major party contest.
(Do you work in any of these states? Contact me to talk!)
Almost every state has something to contest. But as the prior chart shows, even successfully contesting a large number of these swing seats could produce change around key legislative pivots (the majority, the veto override) in a handful of cases, and in each of those cases, many wins at once would be required to cross those crucial thresholds.
In this series of posts I’ll inevitably be focusing on the battleground state legislatures where there is more at stake and more to be gained. (Obviously I’ve picked a poor cycle to be one of the only Election Twitter types to have never lived in Ann Arbor, it seems) I’ll also be focusing on questions I find interesting. These will inevitably cover the nearly 3,000 observations in this dataset who went unchallenged in their most recent elections, will cover the raft of new districts being drawn around the country this year, will probably include a deep dive on campaign finance if I have time, and will also highlight plausible opportunities for synergy between state legislative races and other races occurring in the same geographies (most notably, the Biden campaign). I suppose we’ll have to deal with New Hampshire, too.
Stay tuned and follow me for updates. Don’t forget to help flipthe.house. I’d also be greatful if you’d buy me a coffee to support these efforts.